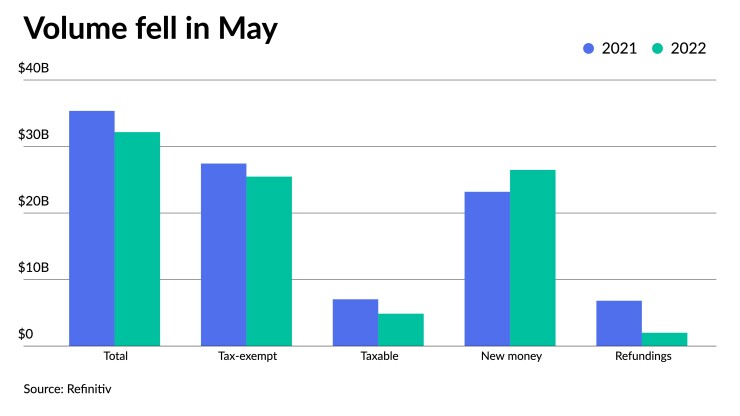
Municipal issuance dropped 9% year-over-year in May, again due to a decrease in taxable and refunding volumes amid continued market volatility and rising interest rates that dominated the front half of the month.
May's $32.2 billion figure is lower than the $33.884 billion 10-year average.
As has been the trend in recent months, total issuance for May was down year-over-year. Pat Luby, senior municipal strategist at CreditSights, pointed to the sharp increase in yields in the three weeks of May as the biggest driver of the drop in issuance.
“If yields are increasing, but at a more methodical pace, it's probably easier for bankers and issuers to manage,” he said. “But the extreme volatility of rates makes investors, as much as issuers, anxious.”
Total May volume was $32.167 billion in 750 deals versus $35.358 billion in 1,295 issues a year earlier, according to Refinitiv data. Taxable issuance totaled $4.868 billion in 82 issues, down 30.8% from $7.030 billion in 236 issues a year ago. Tax-exempt issuance was down 7.2% to $25.476 billion in 654 issues from $27.442 billion in 1,041 issues in 2021.
In a continuing trend, new-money issuance was up 14.2% to $26.483 billion in 674 transactions from $23.192 billion a year prior.
Refunding volume decreased 70.6% to $2.001 billion from $6.814 billion in 2021 and alternative-minimum tax issuance rose to $1.823 billion, up 105.9% from $885.1 million.

Luby said the recent
He said the sell-off in munis made muni yields attractive relative to corporates in a big way. He said that brought buyers in, but the rally last week took that benefit away.
“So we'll have to have to see if there's follow-through demand,” he said. "There are big redemptions getting paid out June 1, but if the market remains steady, where it is right now and steady relative to taxables, demand could be down once the redemptions are done.”
Other factors responsible for the decrease in issuance year-over-year, Matt Fabian, a partner at Municipal Market Analytics, include greater financial uncertainty and fewer issuers needing to raise cash, thus leading to a drop in taxables and refundings.
“You'll have the offsetting trends of higher costs, meaning slowing some issuers down,” Fabian said.
So on a net basis, he said, it makes sense that refundings, which are rate sensitive, would be down.
“The sharper decline of taxable is because there have been fewer advanced refundings," Fabian said. Typically issuers make heavy use of advanced refundings to raise cash for the very near term, he said. “But with most budgets in a surplus situation and more federal money coming, there should be less need for that now than there was a year ago,” Fabian added.
Fabian noted taxable issuance is unlikely to get back to where it was in 2020 and 2021, saying there has already been peak taxable issuance in the muni market.
May saw some states bring billion-dollar deals, including Illinois' $1.7 billion of GOs in mid-May and Connecticut's $1.075 billion of GOs toward the end of the month.
Fabian said states are more able to handle the higher cost of construction and have bigger and more diversified borrowing plans. Therefore, their new-money issuance might be more resilient and less affected by the economics of one or two construction plans, as states are better able to manage construction level inflation.
“The state-level borrowing encompasses many construction projects, typically, so when one project becomes expensive, it’s not all projects becoming more expensive,” he said.
There was also a continued influx of New York paper in May. New York issued the most debt in May at $23.354 billion, up 21.6% year-over-year.
The Triborough Bridge and Tunnel Authority issued $945 million of refunding bond at the start of the month, followed by the Dormitory Authority of the State of New York issuing $1.5 billion of revenue bonds in two deals while New York City priced $1.08 billion of GOs in mid-May.
Credit spreads tightened generally over the last several sessions, particularly New York paper, which saw deals trade up in the secondary during the rally.
Looking forward, even if supply picks up, it is highly unlikely that issuance will
Fabian has slightly revised his yearly total as yields have risen but noted it’s hard “to talk affirmatively about the end of the year.” His $450 billion estimate for 2022 gas been revised to $400 billion.
“Yields will remain volatile, so it makes sense for issuers to borrow to get ahead of that volatility,” Fabian said. “I'm still generally bullish on supply, just not quite as bullish as I was at the beginning of the year before all the pain started.”
Luby hasn’t revised his yearly figures so far but he expects total issuance to be on par with 2019’s $426.347 billion figure.
“Investor demand has been strong at higher yields. If we see less supply, it could actually help prices because there's a risk of more demand than bonds. Many buyers prefer new-issue bonds over secondary market bonds," Luby said.
"We could see the reemergence of a bifurcated market where new issues are getting really strong demand and the secondary market languishes,” Luby added.
Issuance details:
Issuance of revenue bonds increased 16.4% to $16.655 billion from $19.918 billion in May 2021, and general obligation bond sale totals rise only 0.5% to $15.511 billion from $15.440 billion in 2021.
Negotiated deal volume was up 7.0% to $26.396 billion from $24.664 billion a year prior. Competitive sales decreased to $5.667 billion, or 37.4%, from $9.054 billion in 2021.
Deals wrapped by bond insurance dipped 0.4%, with $3.529 billion in 138 deals from $3.544 billion in 243 deals a year prior.
Bank-qualified issuance dropped to $950.1 million 246 deals from $1.554 billion in 414 deals in 2021, a 38.8% decrease.

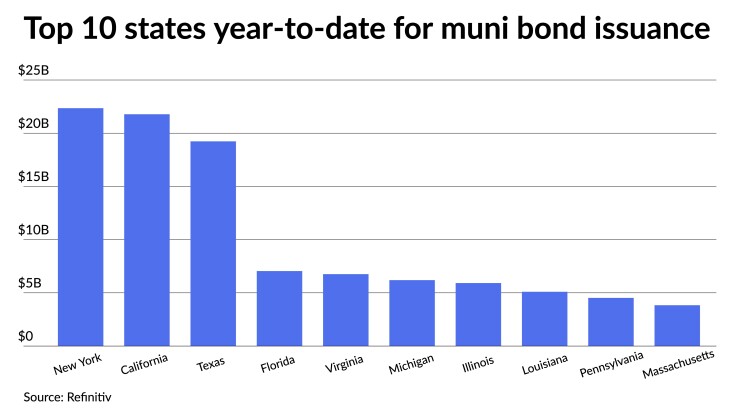
In the states, New York claimed the top spot.
Issuers in the Empire State accounted for $23.354 billion, up 21.6% year-over-year. California was second with $21.784 billion, down 33.4%. Texas was third with $19.237 billion, down 0.2%, followed by Florida in fourth with $7.047 billion, up 4.9%, and Virginia in fifth with $6.195 billion, a 97% increase from 2021.
The rest of the top 10 are: Michigan with $6.195 billion, up 123.6%; Illinois with $5.921 billion, up 8.8%; Louisiana with $5.101 billion, up 116.8%; Pennsylvania at $4.526 billion, down 39.3%; and Massachusetts with $3.838 billion, down 22.5%.


