Retail investors recently have been more engaged in the muni market after large inflows were reported last week. It has been a couple of years since the market has seen this active of a January.
If all $6.6 billion of expected issuance comes this week, that would put this month's issuance at around $15 for the first two weeks of the year. The past two Januarys have netted $21.5 billion in 2018 and $24.9 billion in 2019. Issuance hit $36.05 billion in January 2017.
The demand for muni product can be captured by retail fund flows into the asset class.
“Retail tax-exempt money market funds pulled in $2.2 billion in the week ended Jan. 8, the largest one-week inflow in 35 weeks,” said Pat Luby, senior municipal strategist at CreditSights. “While institutional funds added $1.7 billion last week which is the most since July of 2016.”
Muni ETFs hit major milestone
The current streak of municipal bond inflows is now one-year old, which began in the week ended Jan. 9, 2019. Luby said he believes that part of last week’s increase in mutual fund flows is a result of investors and advisors implementing year-end portfolio reallocations.

“Muni bond ETFs have had positive net inflows for 30 weeks in a row as of last Thursday and now have over $50 billion in assets under management,” Luby said. “Muni bond ETF trading was down slightly from last week’s pace but was still more than 50% heavier than the 2019 average.
Secondary market
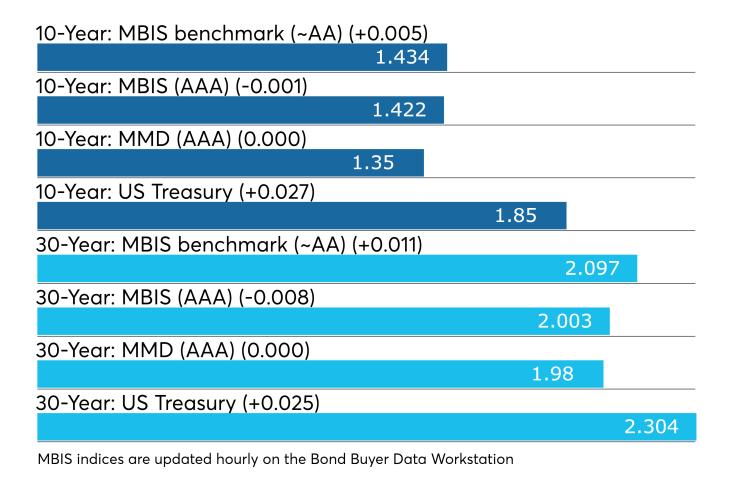
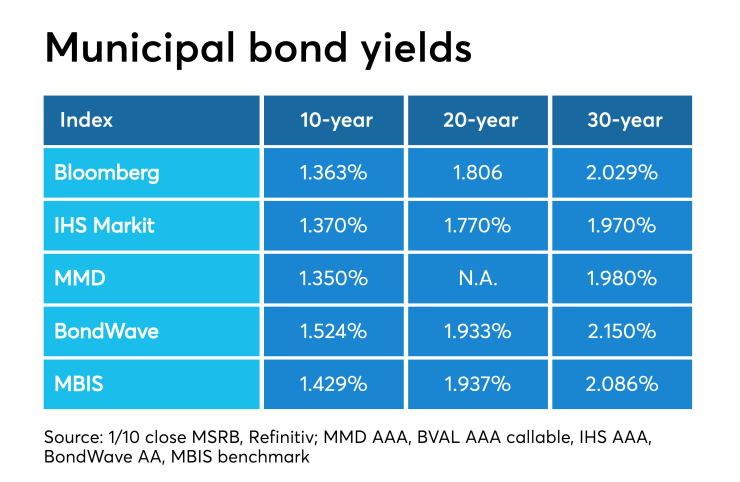
Munis were weaker on the MBIS benchmark scale, with yields rising by less than a basis point in the 10-year maturity and by one basis point in the 30-year. High-grades were stronger, with yields on MBIS AAA scale decreasing less than one basis point in both the 10-year and 30-year maturities.
On Refinitiv Municipal Market Data’s AAA benchmark scale, the yield on both the 10- and 30-year GO were unchanged from 1.35% and 1.98%, respectively.
The 10-year muni-to-Treasury ratio was calculated at 73.9% while the 30-year muni-to-Treasury ratio stood at 86.7%, according to MMD.
Stocks were in the green after reaching highs early in the day and Treasuries yields headed north. The Treasury three-month was yielding 1.554%, the two-year was yielding 1.580%, the five-year was yielding 1.651%, the 10-year was yielding 1.850% and the 30-year was yielding 2.304%.
The record rally rolls on for stocks, as both the S&P and Nasdaq hit new highs during intra-day trading. The Dow Jones was up 0.20%, The S&P 500 increased by about 0.55% and the Nasdaq was up 0.88%.
“The ICE muni yield curve is hovering around Friday’s levels,” ICE Data Services said in a Monday market comment. “Tobacco bonds are one basis point lower in quiet trading, and high yield is unchanged along with Puerto Rico. Taxable yields are up two basis points.”

Primary market
Although the largest deals of the week won’t come until Wednesday and Thursday, the action will commence on Tuesday.
“This week’s new-issue calendar is down 13% from the prior week but the volume of tax-exempt issuance should be up since this week’s taxable volume is expected to be about half of last week’s,” Luby said.
Siebert Williams and Shank is scheduled to price Bexar County Hospital District’s (Aa1 /AA+) $290.645 million of certificates of obligation and limited tax refunding bonds on Tuesday.
Piper Sandler is expected to price Ysleta Independent School District, Texas’ (Aaa/AAA/ ) $263.765 million of unlimited tax school building bonds. The deal is backed by the Permanent School Fund Guarantee Program.
Citi is expected to price Ohio Housing Finance Agency’s (Aaa/NR/NR) $149.995 million of residential mortgage revenue non-alternative minimum tax bonds.
"It's been quite a while since we have had a week with this low of taxable issuance," said one New York trader. "I don't expect this to keep happening however, taxables are definitely here to stay."
Last week’s actively traded issues
According to

Some of the most actively traded munis by type in the week were from California and New York issuers.
In the GO sector, the State of California zeros of 2033 traded 23 times. In the revenue bond sector, the Metropolitan Transportation Authority 4s of 2022 traded 56 times. In the taxable bond sector, the State of California 2.375s of 2026 traded 26 times.
Housing sector should see stable performance in 2020
Economic fundamentals bode well for continued stable performance in the U.S. municipal housing sector, according to S&P Global Ratings analyst Marian Zucker.
"Favorable financial conditions due to a lowered chance of recession, expected low interest rates through the end of the year, modest inflation, steady labor force participation, and continued wage growth — most importantly even for lower wage workers — provides a solid foundation for the sector to remain on largely stable ground during 2020," Zucker said.

She added that the U.S. municipal housing sector consists of mission-driven lenders including housing finance agencies and community development financial institutions and their borrowings; mission-driven owners and operators of affordable housing including public housing authorities and other social housing providers; and securities backed by affordable housing mortgages.
“Each of these sectors will continue to benefit from the economic landscape.” This bodes well for the sector in general, as it is coming off its highest issuance year in 10 years with a total of $25.44 billion in 2019.
Previous session's activity
The MSRB reported 30,466 trades Friday on volume of $12.633 billion. The 30-day average trade summary showed on a par amount basis of $10.72 billion that customers bought $5.66 billion, customers sold $3.25 billion and interdealer trades totaled $1.80 billion.
New York, California and Texas were most traded, with the Empire State taking 14.827% of the market, the Golden State taking 12.369% and the Lone Star State taking 9.622%.
The most actively traded security was the Puerto Rico Sales Tax Financing Corporation restructured COFINA bonds zeros of 2046, which traded 29 times on volume of $65.327 million.
Treasury auctions discount rate bills
Tender rates for the Treasury Department's latest 91-day and 182-day discount bills were higher, as the $42 billion of three-months incurred a 1.530% high rate, up from 1.520% the prior week, and the $36 billion of six-months incurred a 1.530% high rate, up from 1.520% the week before.
Coupon equivalents were 1.562% and 1.568%, respectively. The price for the 91s was 99.613250 and that for the 182s was 99.226500.
The median bid on the 91s was 1.500%. The low bid was 1.470%.
Tenders at the high rate were allotted 80.79%. The bid-to-cover ratio was 2.87.
The median bid for the 182s was 1.505%. The low bid was 1.470%.
Tenders at the high rate were allotted 65.92%. The bid-to-cover ratio was 2.98.
Gary E. Siegel contributed to this report.
Data appearing in this article from Municipal Bond Information Services, including the MBIS municipal bond index, is available on The Bond Buyer Data Workstation.


