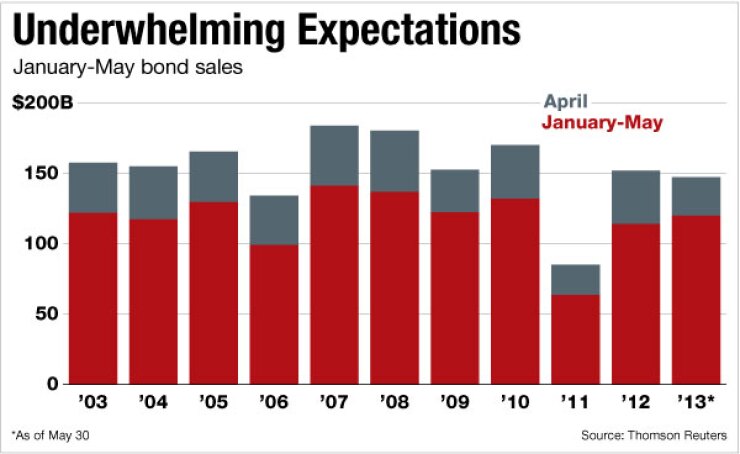
Issuance numbers for long-term municipal bonds in May continued to underwhelm market expectations.
Volume for the month decreased 28% from the same period in 2012 to $27.3 billion in 1,226 deals from $37.9 billion in 1,496 issues, Thomson Reuters numbers revealed.
Most categories showed declines for the month.
For the year to date, long-term issuance is down 3%, on $147.2 million in 5,255 deals. That compares with $151.8 million in 5,755 issues through May 2012.
Issuance in May fell well below the five-year average of $34 billion, and the 10-year average of $36 billion, said Sean Carney, BlackRock muni strategist. What’s more, he added, the numbers represented only the third time in a decade that issuance for May trailed April’s.
“It’s too early to think about revising 2013 projections, but it does make you wonder what is holding issuance back,” Carney said. “Volatility was likely the culprit in May; fund flows down 63% year-over-year may have been another reason. But there will be questions to answer if June fails to impress, given that it’s the heaviest issuance month of the year, on average.”
At this point in the year, muni participants are beginning to understand that supply shocks in a credit market are less frequent, and driven more by a lack of demand than an unexpected spike in primary issuance, Carney said.
Taxable volume jumped 77% last month, to $3.9 billion in 135 issues, compared with $2.2 billion in 123 deals one year earlier. Through the first five months of 2013, taxable issuance has more than doubled from a year earlier, to $21.4 billion in 592 deals from $9.5 billion in 429 issues.
Tax-exempt volume has fallen 12% for the year to date, and dropped 34% in May. May’s tax-exempt numbers totaled $23.0 billion in 1,082 issues, against almost $35.0 billion in 1,359 deals.
New-money issuance fell 21% last month, to $11.5 billion in 647 issues, from $14.6 billion in 723 deals in May 2012. For the year to date, though, new-money volume has climbed 7%, to $58.1 billion in 2,271 issues from $54.5 billion in 2,252 deals through May 2012.
“It’s encouraging that new-money issuance is increasing, albeit modestly,” Carney said. “It’s likely a sign of greater tax receipts, removing some budget pressure as out-gaps shrink. We anticipate this continues as the year matures.”
Refunding issuance, by comparison, has fallen 7% so far in 2013, to $61.8 billion in 2,485 deals, versus $66.9 billion in 3,009 issues through May 2012. For the month, re-fis decreased 32% to $11.2 billion in 476 issues from $16.6 billion in 628 deals a year earlier.
Education bonds posted the only increases in issuance among sectors, rising 20% last month to $10.3 billion from $8.6 billion in May 2012. Large sectors such as general purpose, transportation and utilities saw declines month-over-month in volume of 30%, 60% and 47%, respectively.
Negotiated issuance last month fell 28% to $20.5 billion from $28.3 billion in May 2012. Competitive volume dropped 24% to $6.6 billion from $8.7 billion.
Revenue bond issuance plunged 37% last month to $14.7 billion from $23.5 billion in May 2012. General obligation volume fell 13% over the same period to $12.6 billion from $14.4 billion.
Among the largest state and local governments, districts issued 8% more last month than they did in May 2012, with almost $7.0 billion against $6.4 billion. Volume from state agencies and from cities and towns dropped 25% and 35%, respectively, over the same period.
Issuers in California, as is almost customary, floated more in bonds than any other state through May. Golden State issuance totaled $23.8 billion in 376 deals, an increase of 20% over the $19.9 billion in 303 issues a year earlier.
The numbers for California aren’t surprising as rates edge higher, said Paul Montaquila, a fixed income investment officer with Bank of the West and BNP Paribas Securities Corporation. Most likely, municipalities are borrowing and or refinancing as quickly as they can, he said.
California had its first budget surplus in nearly a decade and is set to issue more debt than any other state — in excess of $5 billion, by one account Montaquila cites.
“There is huge demand for California paper,” he said. “And the spike in rates should help, considering the tightening of spreads since the upgrade. I’m certain our customers will look to California muni bonds as an option when searching for yield.”
Texas issuers jumped one notch in the rankings year to date, placing second on 1% less volume. The Lone Star State issued $13.5 billion in 600 deals, against $13.6 billion in 558 issues one year earlier.
New York fell one spot to third as issuers in the state produced 29% less in volume through the first five months of 2013. The Empire State has floated $11.7 billion in 276 issues, versus $16.4 billion in 417 issues through May 2012.
New Jersey and Florida issuers filled out the final two spots in the top five. New Jersey jumped from 11th place on a 91% increase in issuance year to date, to $8.2 billion in 145 deals from $4.3 billion in 172 issues through five months in 2012.
Florida issuers did 10% more in volume, with $6.6 billion in 97 deals through May. That compares with almost $6 billion in 97 issues through the same period one year earlier, when it ranked sixth.
No deals in May topped $1 billion. Still, Missouri Higher Education Loan weighed in with $956 million in taxable debt for student loans issued on May 21.
New York City followed by issuing $949 million in GOs on May 24. The New Jersey Turnpike Authority on May 20 floated $646 million of refunding bonds.


