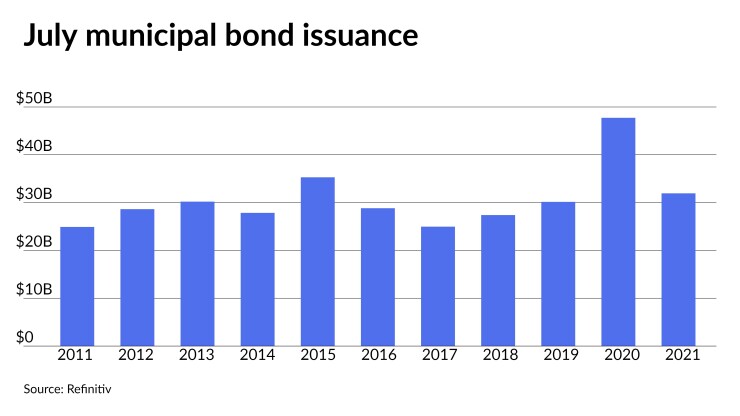
Issuance in July fell more than 30% short of 2020 figures but is roughly 13% above the month’s 10-year average, while total issuance for the year-to-date is ahead of last year’s record-breaking pace by a small margin.
At $31.9 billion, municipal bond volume was 33.1% lower this month than July 2020 when it totaled a whopping $47.7 billion due to COVID-related issuance delays from earlier in the year. July still marks a solid figure for the month historically and keeps 2021 issuance levels elevated.
Currently, muni volume is at $263.29 year-to-date versus $258.09 billion in the same period in 2020.

Issuance still lags demand by a large amount — $60 billion by many accounts for August alone — as redemptions coupon payments pile up.
Although volume has been in excess of $30 billion every month this year, with the exception of January, Dan Heckman, senior fixed-income strategist at U.S. Bank Wealth Management noted July volume slowed later in the month and this may be the trend going forward.
“We did not end the month on an upswing, more on a downswing volume wise,” he said. “We will see if August reverses the downward trend, but not I am not optimistic, as I get the feeling that issuers are waiting to see what happens with this infrastructure deal.”
Tax-exempt issuance was down 22.4% to $22.76 billion from $26.51 billion last year, taxable volume was 52.3% lower to $8.73 billion from $18.32 billion in 2020.
New-money issuance dropped 15.2% to $22.76 billion from $26.84 billion, while refundings fell 53.9% to $6.95 billion from $15.09 billion.
Historically low rates and healthy demand are a good recipe for high issuance, but that has not come to fruition in a year marked with continued uncertainties from the pandemic and mixed messages on infrastructure from Washington.
Heckman added, unless rates “dramatically” drop, he doesn’t see volume picking up significantly.
“It is puzzling to me why there isn’t more issuance, given the technicals and backdrop,” Heckman said. “The summer slow-down could also be playing a factor. Once we get into August and September, we will have a better idea of if we have a year-end rally of issuance or not.”
Tom Kozlik, head of municipal strategy and credit, Hilltop Securities, recently upped his forecast for yearly volume but doesn’t see another record year in store for munis.
“I just increased our issuance forecast for 2021 to $460 billion from $375 billion, so I think it is actually running higher than I initially expected,” he said. Kozlik's initial forecast was on the low end of a spectrum that had others seeing $500 billion-plus for the year.
Kozlik noted demand for bonds is not the only factor that drives issuance. “Issuer ability to pay off the bonds and growth better determine the need for more debt,” he said.
Federal COVID-19 relief aid is also a factor.
“Federal money is raining from the sky into municipalities, so issuers are flush with cash and have no urgent need to incur more debt,” U.S. Bank's Heckman noted.
Only one sector was in the green this month — public facilities, which increased to $1.84 billion from $362.9 million.
“In general, I would say that public facilities are aging and need repairs and upgrades, so I am not surprised to see that,” he said. “Also jails and correctional facilities are also a common need throughout the country.”
Direct issues increased 86.4% to $90.8 million from $48.7 million and cities and towns were up 22.3% to $6.82 billion from $5.58 billion.
After seven months, California is the top issuer with a total of $42.93 billion. New York is second with $28.86 billion, followed by Texas with $28.70. Pennsylvania is fourth with $11.68 billion and Florida rounds out the top five with $9.95 billion.


