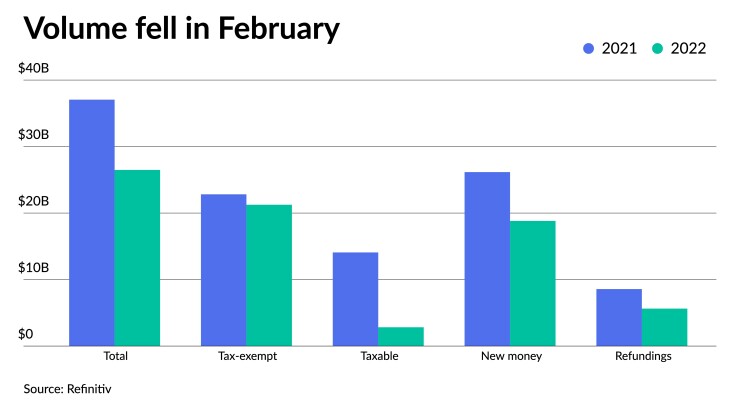
Municipal bond issuance fell 28.5% year-over-year in February led in part by a massive drop in taxable and refunding volumes amid extreme market volatility and a rising-rate environment.
Total February volume was $26.481 billion in 594 deals versus $37.052 billion in 981 issues a year earlier. Taxable issuance totaled a mere $2.825 billion in 73 issues, down 79.9% from $14.079 billion in 247 issues a year ago. Tax-exempt issuance was down 6.9% to $21.249 billion in 511 issues from $22.819 billion in 727 issues in 2021.
New-money issuance was down 28.1% to $18.817 billion in 449 transactions from $26.162 billion a year prior while refunding volume decreased 34.3% to $5.630 billion from $8.570 billion in 2021. Alternative minimum tax inssuance rose to $2.407 billion, up 1,464.9% from $153.8 million.

The beginning of the calendar year typically gets off to a slower start, but in 2022, supply has been especially light due to market volatility and issuer fears over rate volatility. Indeed,
“The story continues to center on declining taxable issuance and the move in rate markets has directly driven the reduction in issuance,” said Jim Grabovac, vice president and municipal bond investment strategist at Loomis, Sayles & Co.
“Both the magnitude and the speed with which it has occurred are contributory. Magnitude, as it has reduced the economic value of taxable advance refundings, and the speed at which rates have moved higher has likely caused some issuers to take a step back to assess developments,” he said.
Erin Ortiz, managing director of municipal research at Janney Montgomery Scott LLC, said the tide is changing as it’s not as favorable to issue taxables.
Ortiz said she doesn’t foresee taxable issuance being issued unless it “was issuing debt for a potential pension fund or some sort of advanced refunding."
“The difference between the tax-exempt rates and USTs continues to widen, and that's just not going to make sense economically to the issuers,” Ortiz said.
Grabovac said greater stability in rate markets should ultimately result in a pickup of taxable issuance over the medium term. There remains a large amount of outstanding debt that can be refinanced economically in today’s environment despite the backup in rates. However, he said, geopolitical developments will impede any near-term return to normalcy.
Many experts estimate the Federal Reserve will raise interest rates four to five times this year, beginning in March, and some forecast as many as seven rate hikes.
Higher municipal rates could attract crossover buyers into the tax-exempt space, Grabovac said.
“Since the pandemic, the market has been a lot more attractive relative to Treasuries,” he said. “But at the same time, corporate credits have cheapened considerably and underperformed the municipal market. Therefore, it presents on the crossover basis more attractive.”
And with both
On the one hand, state and local issuers flush with federal cash and rising tax revenues will not need to borrow as much this year, but on the other, newly strengthened issuers will now be able to undertake much needed investment to shore up aging property, plant, and equipment, Grabovac said.
“From the funding perspective, that's where you could have some more question marks as to what makes sense at this point in time,” she said. “It's difficult to call given many aspects are up in the air at this point.”
The Infrastructure and Investment and Jobs Act could increase issuance, but only slightly, later in the year once more Treasury guidance comes out.
Ortiz said a lot of municipalities and other entities that issue municipal debt are in a good position right now from the various stimulus and recovery funds they've received for the past couple of years. Therefore, any additional funding would spark additional issuance, but only a little bit.
For 2022,
"We expect that an issuance pickup however, may be more of a 2023 than 2022 eventuality, if indeed it does occur," he said.
Issuance details:
Issuance of revenue bonds decreased 28.2% to $17.239 billion from $23.996 billion in February 2021, and general obligation bond sales dropped 29.2% to $9.242 billion from $13.056 billion in 2021.
Negotiated deal volume was down 23.9% to $19.052 billion from $25.036 billion a year prior. Competitive sales also decreased to $7.241 billion, or 13.4% from $8.366 billion in 2021.
Deals wrapped by bond insurance were down 75.8%, with $1.107 billion in 82 deals from $4.568 billion in 192 deals a year prior.
Bank-qualified issuance dropped to $535.1 million 128 deals from $1.115.0 billion in 289 deals in 2021, a 52.0% decrease.

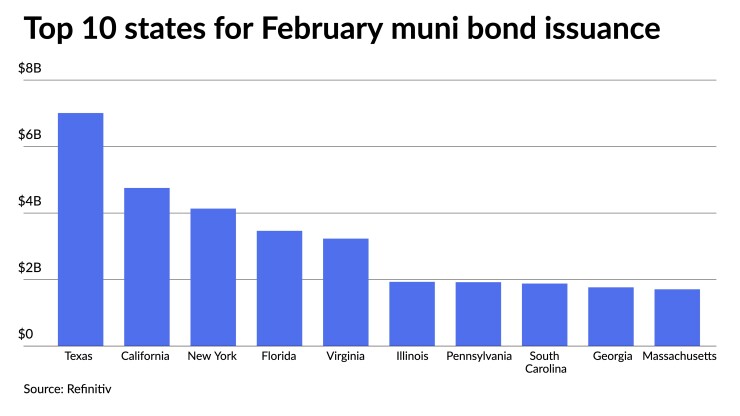
In the states, Texas retained the top spot.
Issuers in the Lone Star State accounted for $7.009 billion, down 14.1% year-over-year. California was second with $4.755 billion, down 59.5%. New York was third with $4.134 billion, down 41.0%, Florida is fourth with $3.465 billion, up 59.5%, and Virginia rounds out the top five with $3.231 billion, a 243.4% increase from 2021.
The rest of the top 10 are: Illinois with $1.931 billion, down 6.7%; Pennsylvania with $1.922 billion, down 13.0%; South Carolina with $1.880 billion, up 218.4%; Georgia at $1.766 billion, up 395.3%; and Massachusetts with $1.708 billion, up 34.7%.


